June 26, 2023
8
min read
Defining trade areas using worker movement
How do you determine the 'Catchment' your site sits within? Discover how we use worker movement to define Catchments
How do you determine the 'Catchment' your site sits within? Discover how we use worker movement to define Catchments
When office building landlords are reviewing the retail mix within a site, they need to consider the retail area within which their building resides - we call this a building "catchment". But what exactly is a catchment? It is essentially, an understanding of the commercial ecosystem within which those retail services operate. Understanding a building’s catchment is crucial in asset management, development and leasing, as they greatly impact a property owners' placemaking and retail mix strategy, as well as building design and feasibility.
But how is this catchment determined for any given office building? It can be derived using geographical areas, such as the city blocks within the proximity to the subject building. But how many city blocks surrounding the building is appropriate? And what happens when there are geographical boundaries nearby such as rivers, harbours, freeways, bridges and/or train lines?
Historically the property industry has used a “rule of thumb”, adopting an existing statistical area produced by the ABS or just had a crack at what felt right. As an approach, this does seem a little arbitrary.
At propella.ai, we decided to take a more scientific approach to determine the likely catchment area for any office building, by examining office worker behaviour.
propella.ai has developed the technology to identify (probabilistically) the workers within an office building, from a sample cohort of de-identified mobile devices. Let’s step through the process for worker identification.
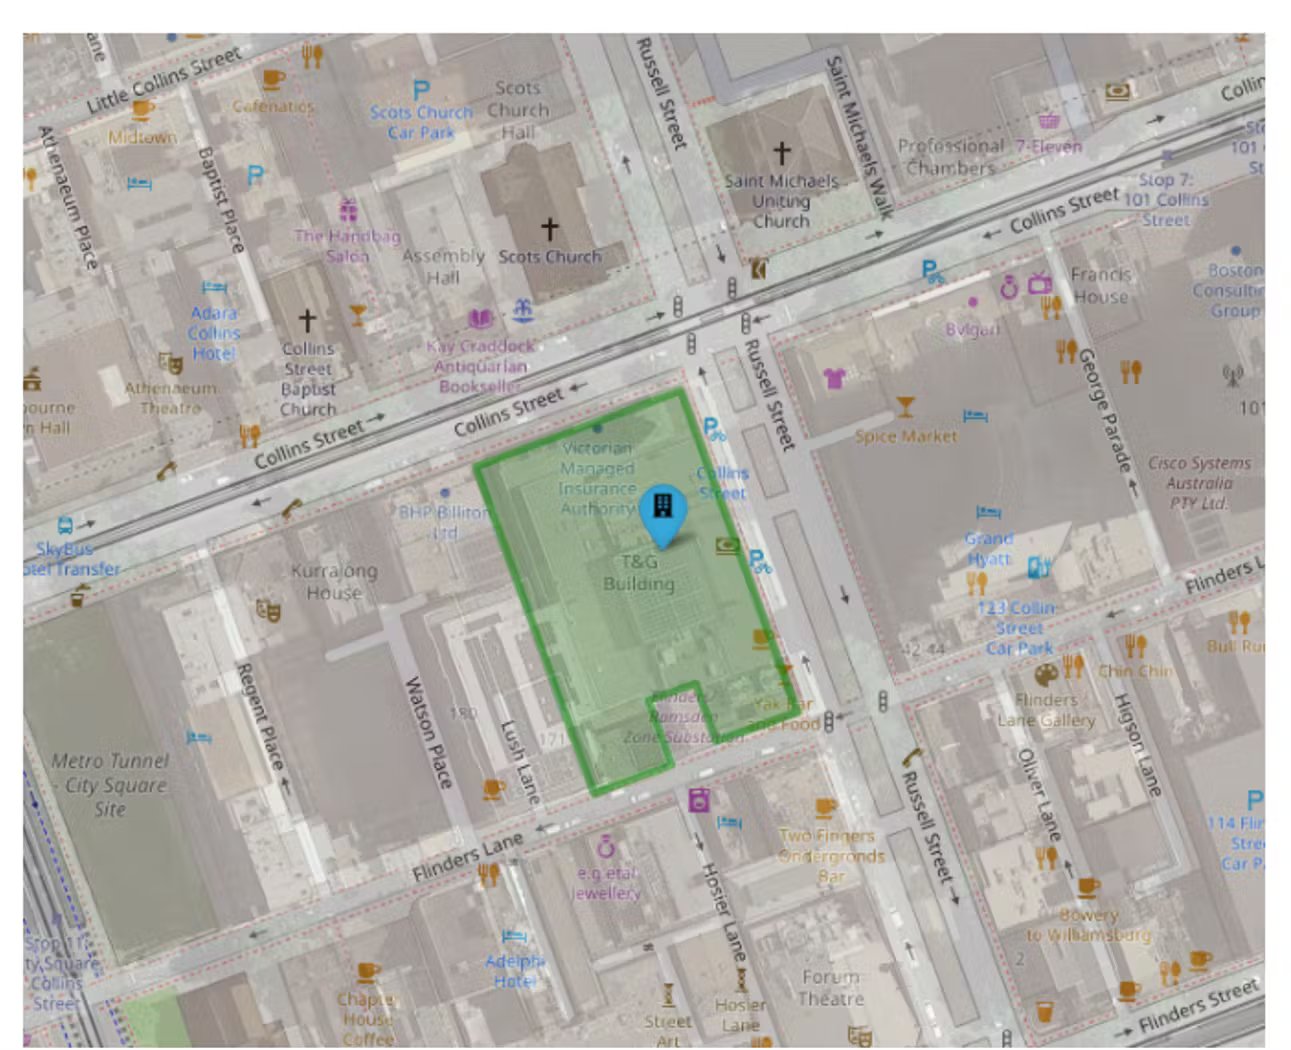
The first step is to define the envelope of the subject building, using what in geo-spatial terms is called a ‘polygon’. This polygon defines the area that will be analysed, or ‘geo-fenced’.
We then identify all mobile devices from our mobile location data using our platform. These mobile devices have been observed within the building polygon over the defined date range, dating back to August 2019. This process is called a ‘geospatial intersection’
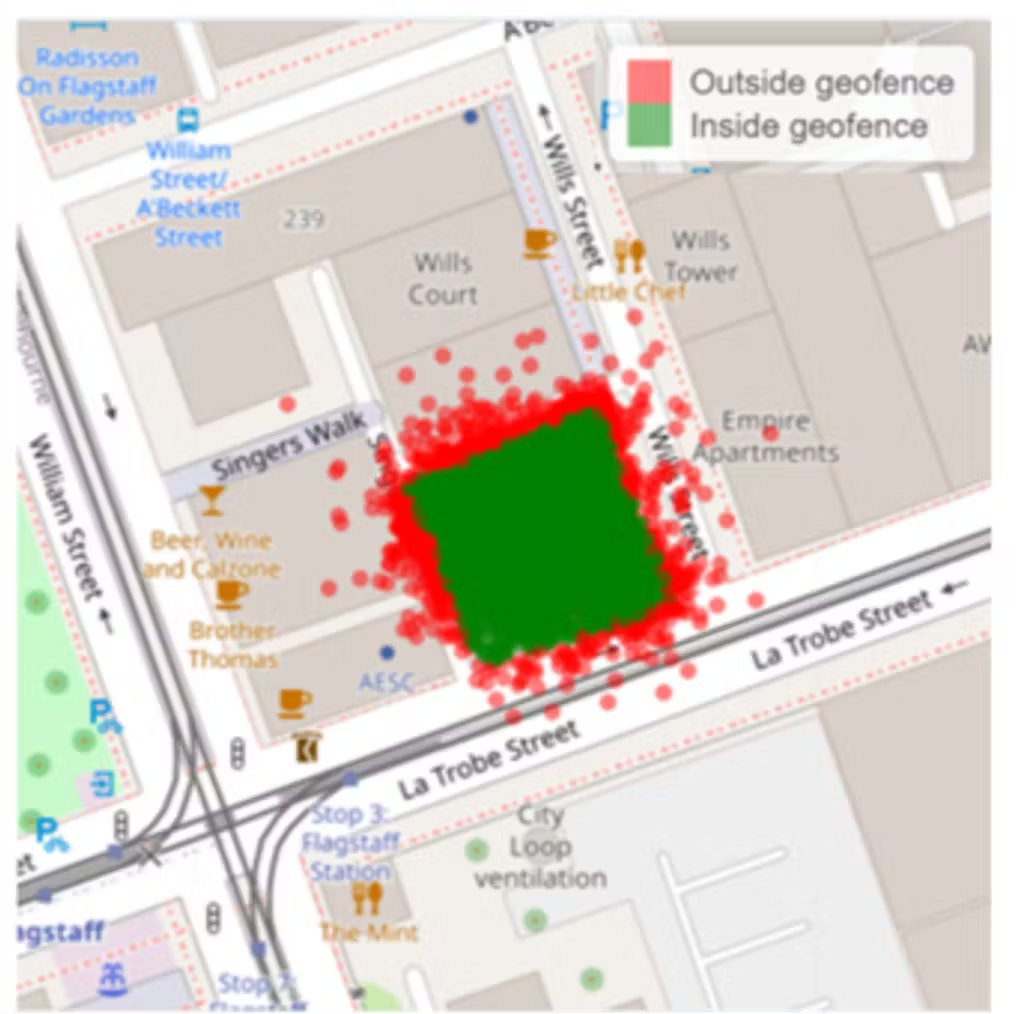
Once the mobile devices within the building polygon have been identified, we run a proprietary algorithm that seeks to (probabilistically) classify each device’s unique interaction with the building. Each device is labelled as either being associated with a building office worker, or a visitor to the building. The algorithm uses a variety of spatial and temporal (time-based) factors to determine this classification, such as the frequency and duration that the mobile device was observed within the building. The result is a cohort of devices that represents a sample of office workers for the subject building. Note that the mobile location data has been de-identified (i.e. contains no personal information such as names, phone numbers, addresses etc) so we have no visibility into who the users/owners of the worker devices are (nor do we seek to ever determine this). In addition, we do not have the ability to “push” any content to these devices, (nor do we seek to ever do this).
With the set of likely office worker devices identified, we can now analyse where this group of devices is also observed outside the subject building. This is where we can start to review worker movement, to make some inferences of office worker behaviour.
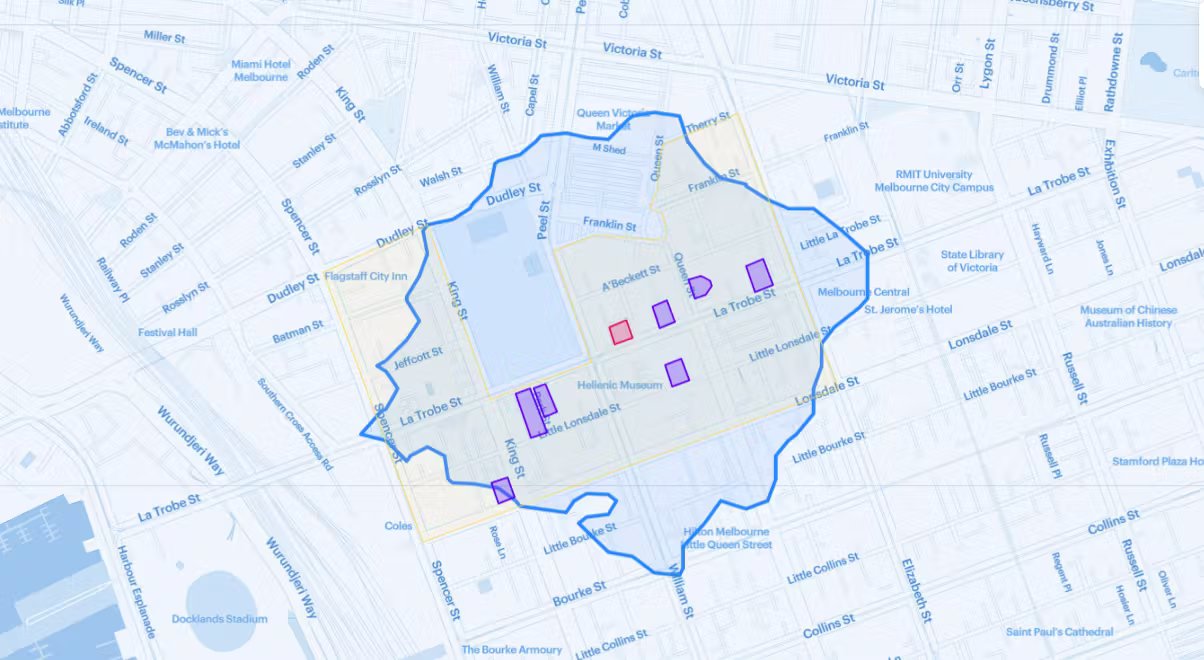
To measure worker movement, we generate walking areas surrounding a subject building. These areas visualise the derived maximum distance that can be walked in any direction from the building in a set amount of time. These walking areas are called ‘isochrones’. Figure 3 visualises the isochrone that is derived using a walk time of 4 minutes in any direction from the subject building. To generate these isochrones, an external service is used that can calculate isochrones for different travel modes, including walking, driving, cycling and even public transport.
.webp)
We can now ‘intersect’ the mobile events observed for our worker cohort with these isochrones of increasing walking distance (in minute increments). We visualise how the density of mobile events decreases as workers travel further from the subject building. Figure 4 illustrates how the number of mobile events rapidly decreases as the isochrone distances increase. Most significantly, the decay begins to plateau after the 7th minute isochrone (in a relationship mathematically termed asymptotic).
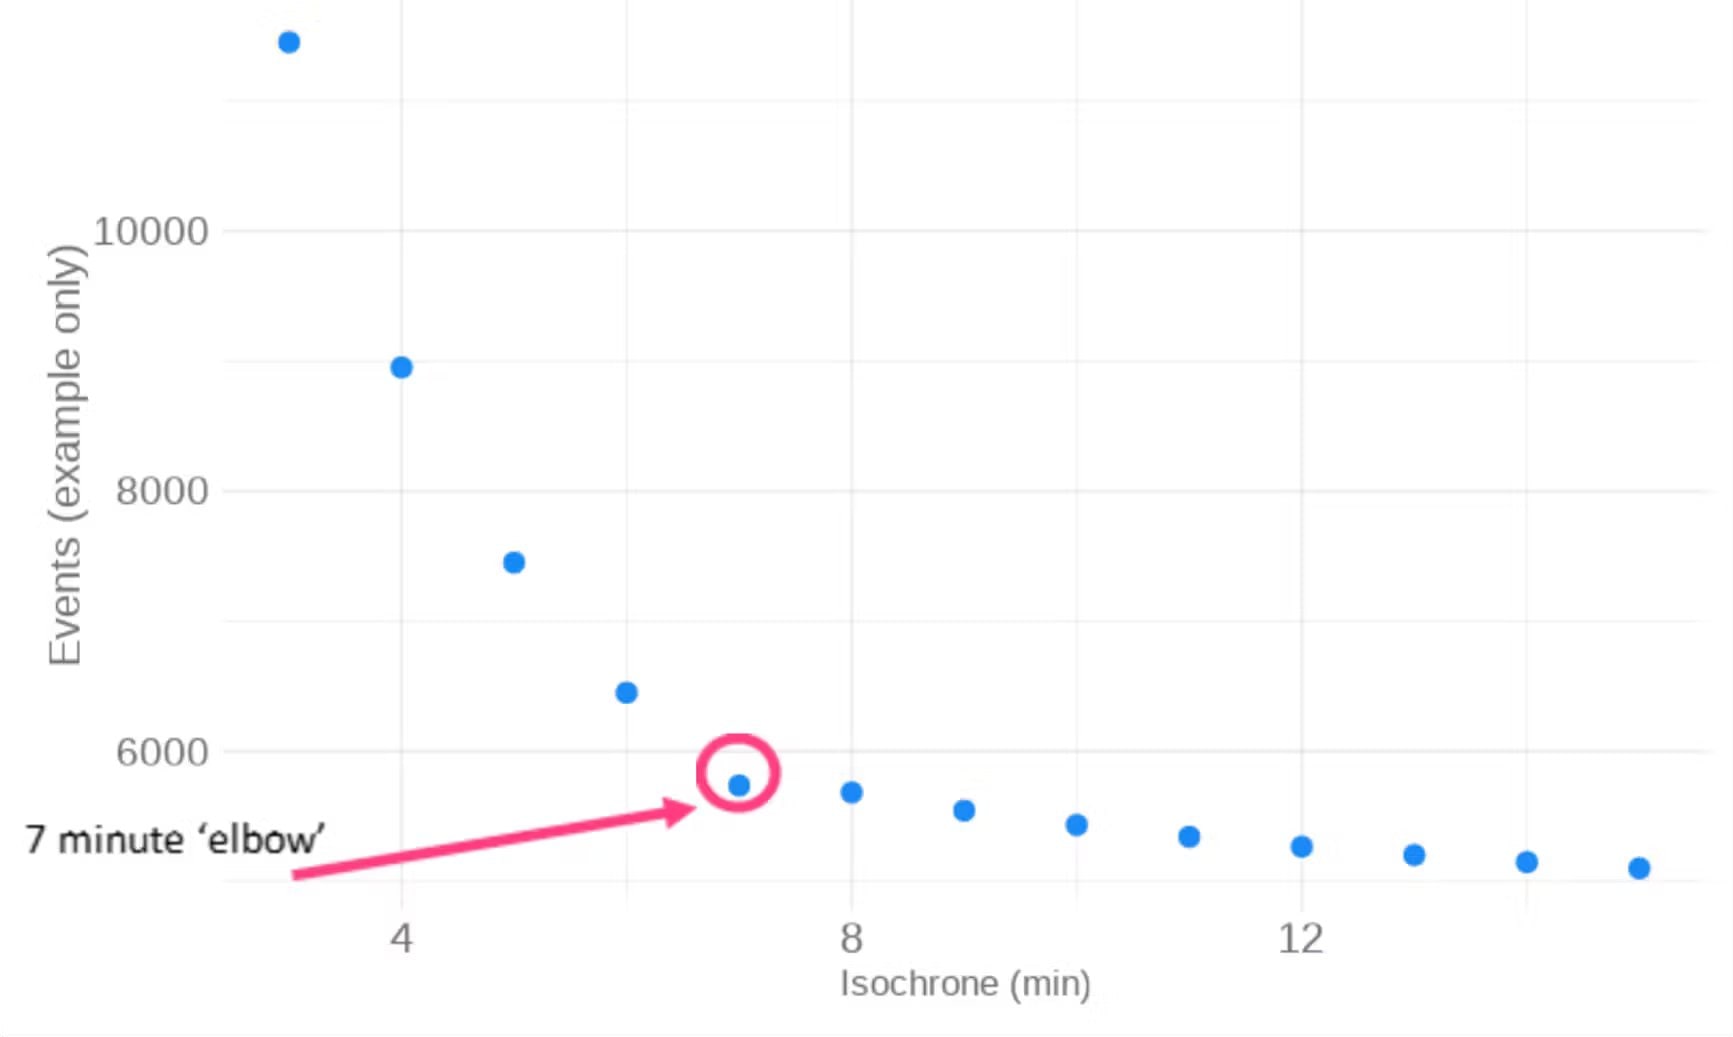
There is an observed “elbow” that the data makes at the 7-minute isochrone mark. In clustering theory, identifying this elbow is often used to find at which point adding a new cluster to the analysis will not provide any useful further insights as after this point variance remains quite similar (shown in the graph as the points past 7 minutes appear to somewhat plateau). The elbow is the point at which observed worker movement density notably changes.
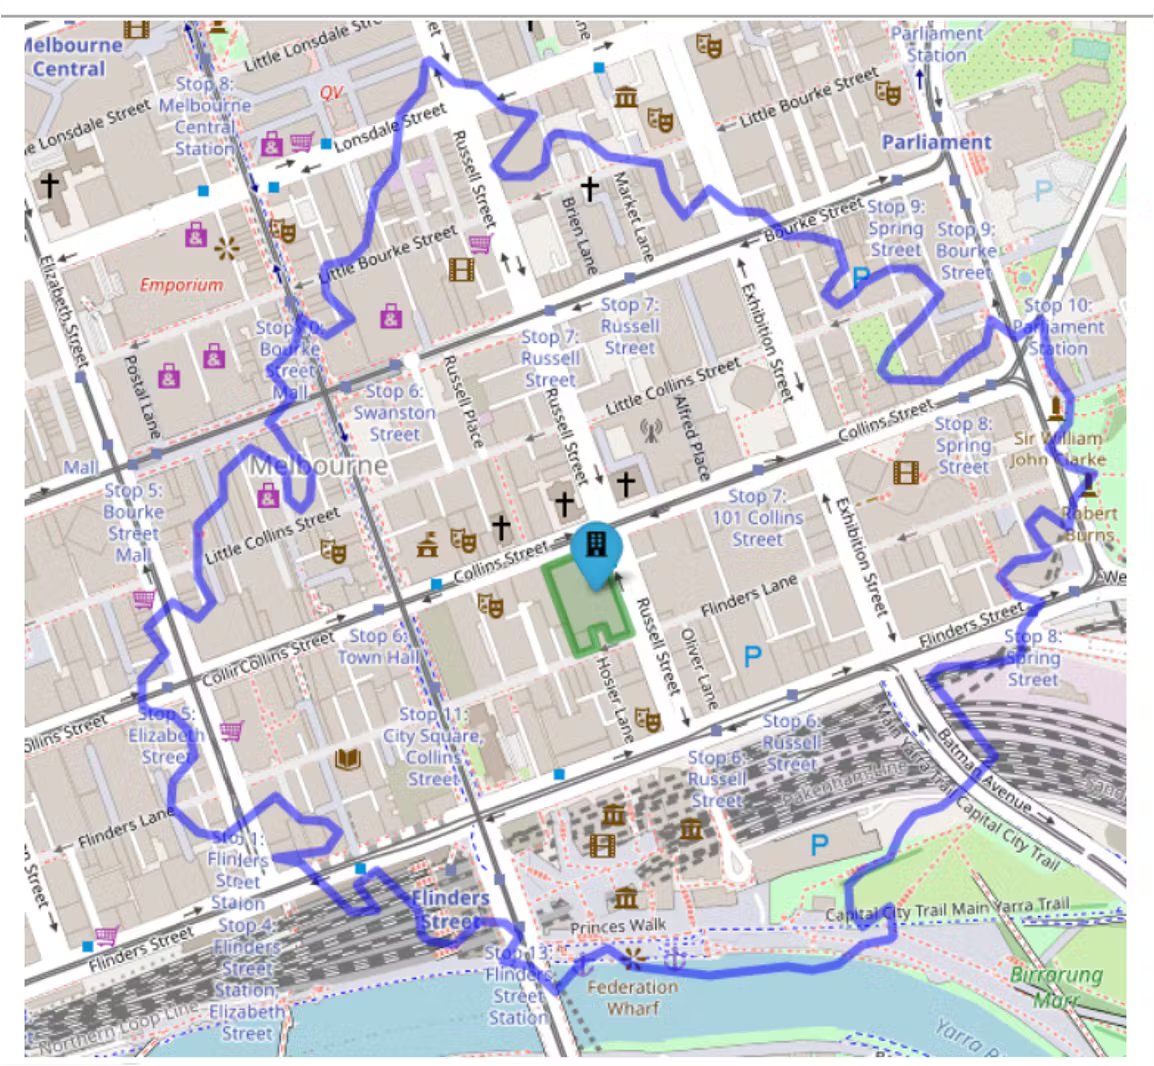
The propella.ai team selected a number of large office buildings within the Melbourne CBD and repeated this analysis. It was determined that all of the buildings were observed to have a very consistent worker movement pattern, with ‘elbows’ observed in the 6-8 minute range. The conclusion from the team was that the 7-minute walking isochrone area represents the maximum threshold at which you are most likely to observe an office worker from their building. Figure 5 below illustrates the 7-minute walking isochrone for an office building. As such, we propose that a 7-minute walk defines the likely catchment for a typical CBD office building. We believe that this best represents the area within which workers will typically travel for their everyday retail needs, such as grabbing a coffee, buying lunch, dropping off dry cleaning, going to the bank or pharmacy, etc.
This “catchment” underpins how we analyse the retail ecosystem within which CBD office buildings are situated.
We then analyse:
· “Hot spots” within the 7-minute catchment area where office workers from a particular office building frequent, such as popular nearby gyms before work, food courts at lunchtime, bars and train stations in the evening
· How many retail businesses exist within the catchment for the various retail categories of interest (cafes &restaurants, hairdressers, pharmacies, health & fitness centres, etc.), and how those numbers compare to the CBD average.
· The most popular food & beverage venues and cuisine types within the catchment.
· The theoretical under-supply and over-supply of over 30 categories of retail businesses, using our proprietary AI-based model to help understand which retail categories will be sustainable for that specific catchment.
These will be discussed further in future blogs.
If you’d like to determine the catchment surrounding your building, or would like a demo to understand the insights we can deliver on the commercial ecosystem in which your property is located, reach out today at www.propella.ai/contact


.jpg)
